Where this started
This project started the same way a lot of fantasy obsessions do: I picked up The Eye of the World and kept finding myself flipping back to the map at the front of the book.
I've always loved maps, especially fantasy maps. There's something about seeing a world laid out in front of you that makes a story feel much bigger.
It took me almost two years to finish The Wheel of Time, partly because I read other series in between, and partly because life got busy, so reading happened in whatever small pieces of free time I could find.
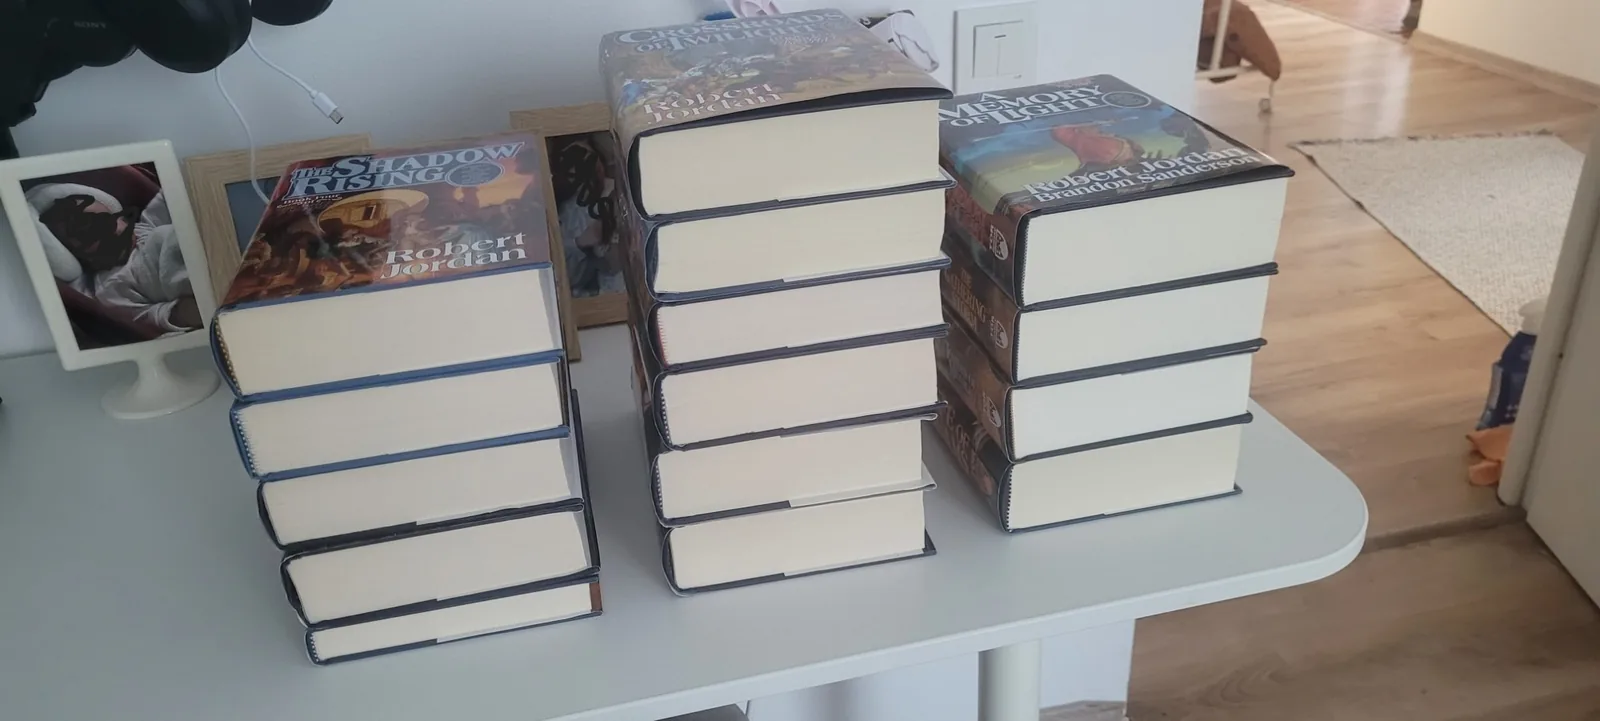 (opens full size)
As I read, I kept wanting something that the book map couldn't really provide.
Where exactly is everyone right now?
How far is one city from another?
What route did they actually take?
What happened at this location earlier in the story?
So I started looking online.
I found some great Wheel of Time resources, including Wheel of Timelines, which has an interactive map, character routes and a timeline of events throughout the series. It was exactly the kind of resource I was looking for. To keep myself safe from spoilers, I also leaned on the Wheel of Time Compendium app, whose character entries only show what you've learned up to the book you're on.
The problem was everything else.
Searching for information on wikis or fandom pages about a series you're still reading is basically walking through a minefield of spoilers.
At some point I thought: I'm a web developer. Why don't I just build my own interactive map?
And that's where this started.
First attempts: I'm not an artist
There was one fairly obvious problem.
I can't draw.
I didn't want to use somebody else's artwork without permission, either, so my first instinct was to try to learn how to make the map myself.
I bought a drawing tablet, failed miserably, and now it just sits on my desk. I tried Wonderdraft and Inkarnate. I bought different asset packs with trees, mountains and other map elements that I thought I needed at the time.
Eventually I managed to put together a first draft of the world map.
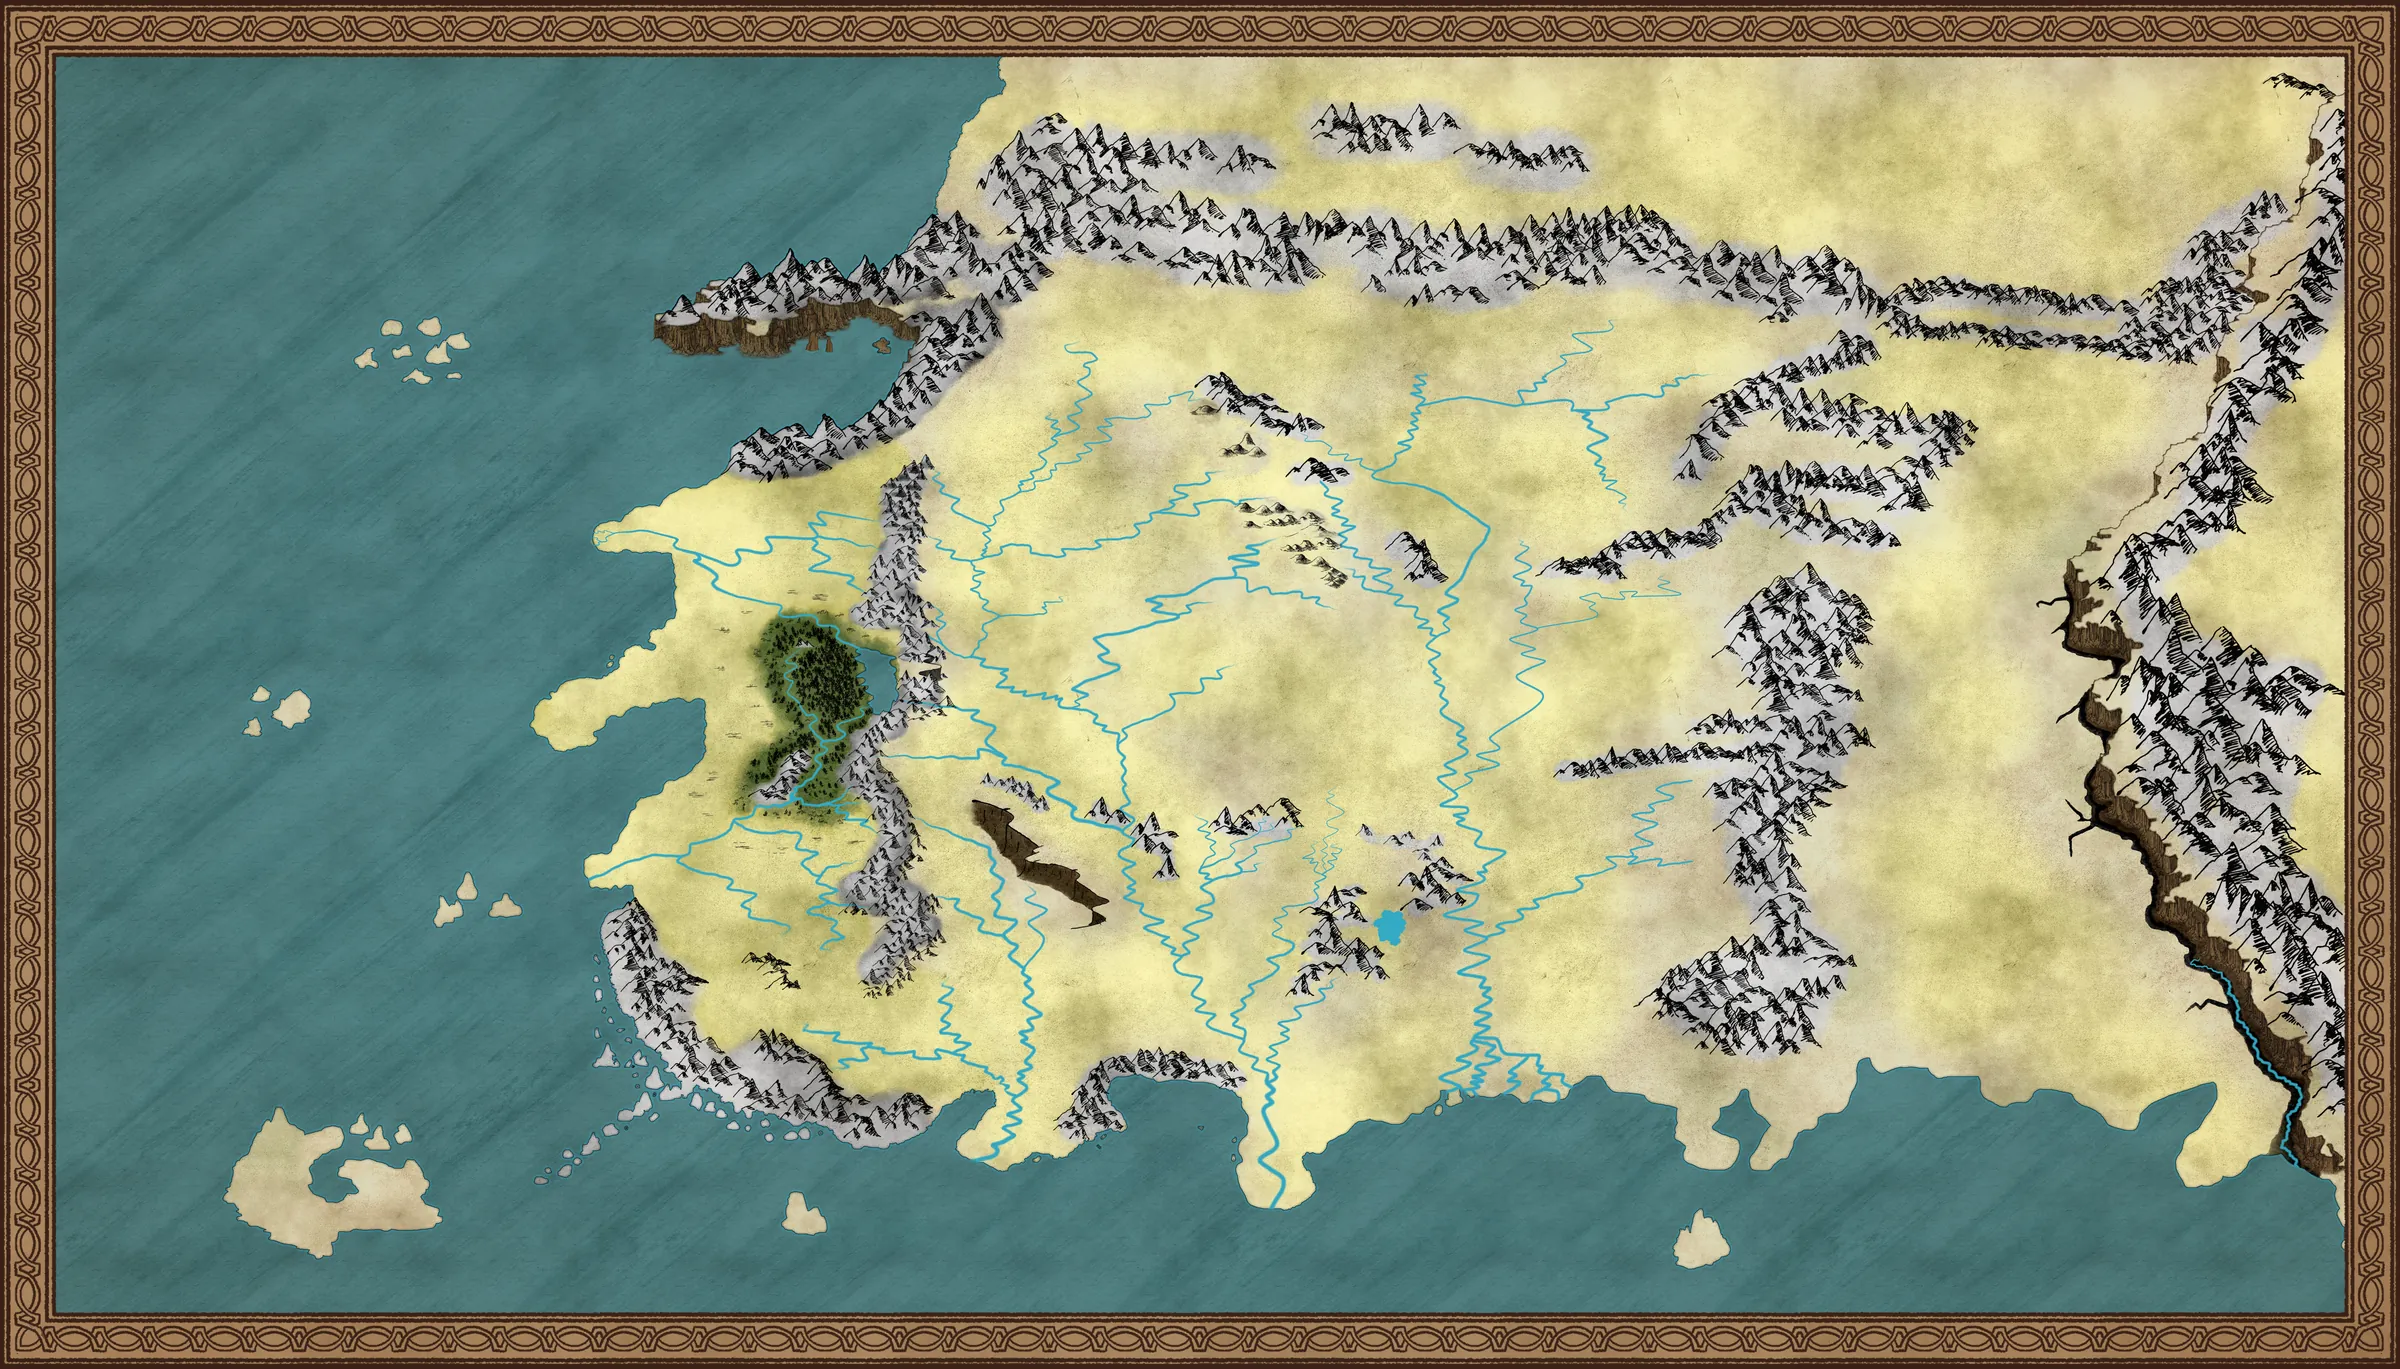 (opens full size)
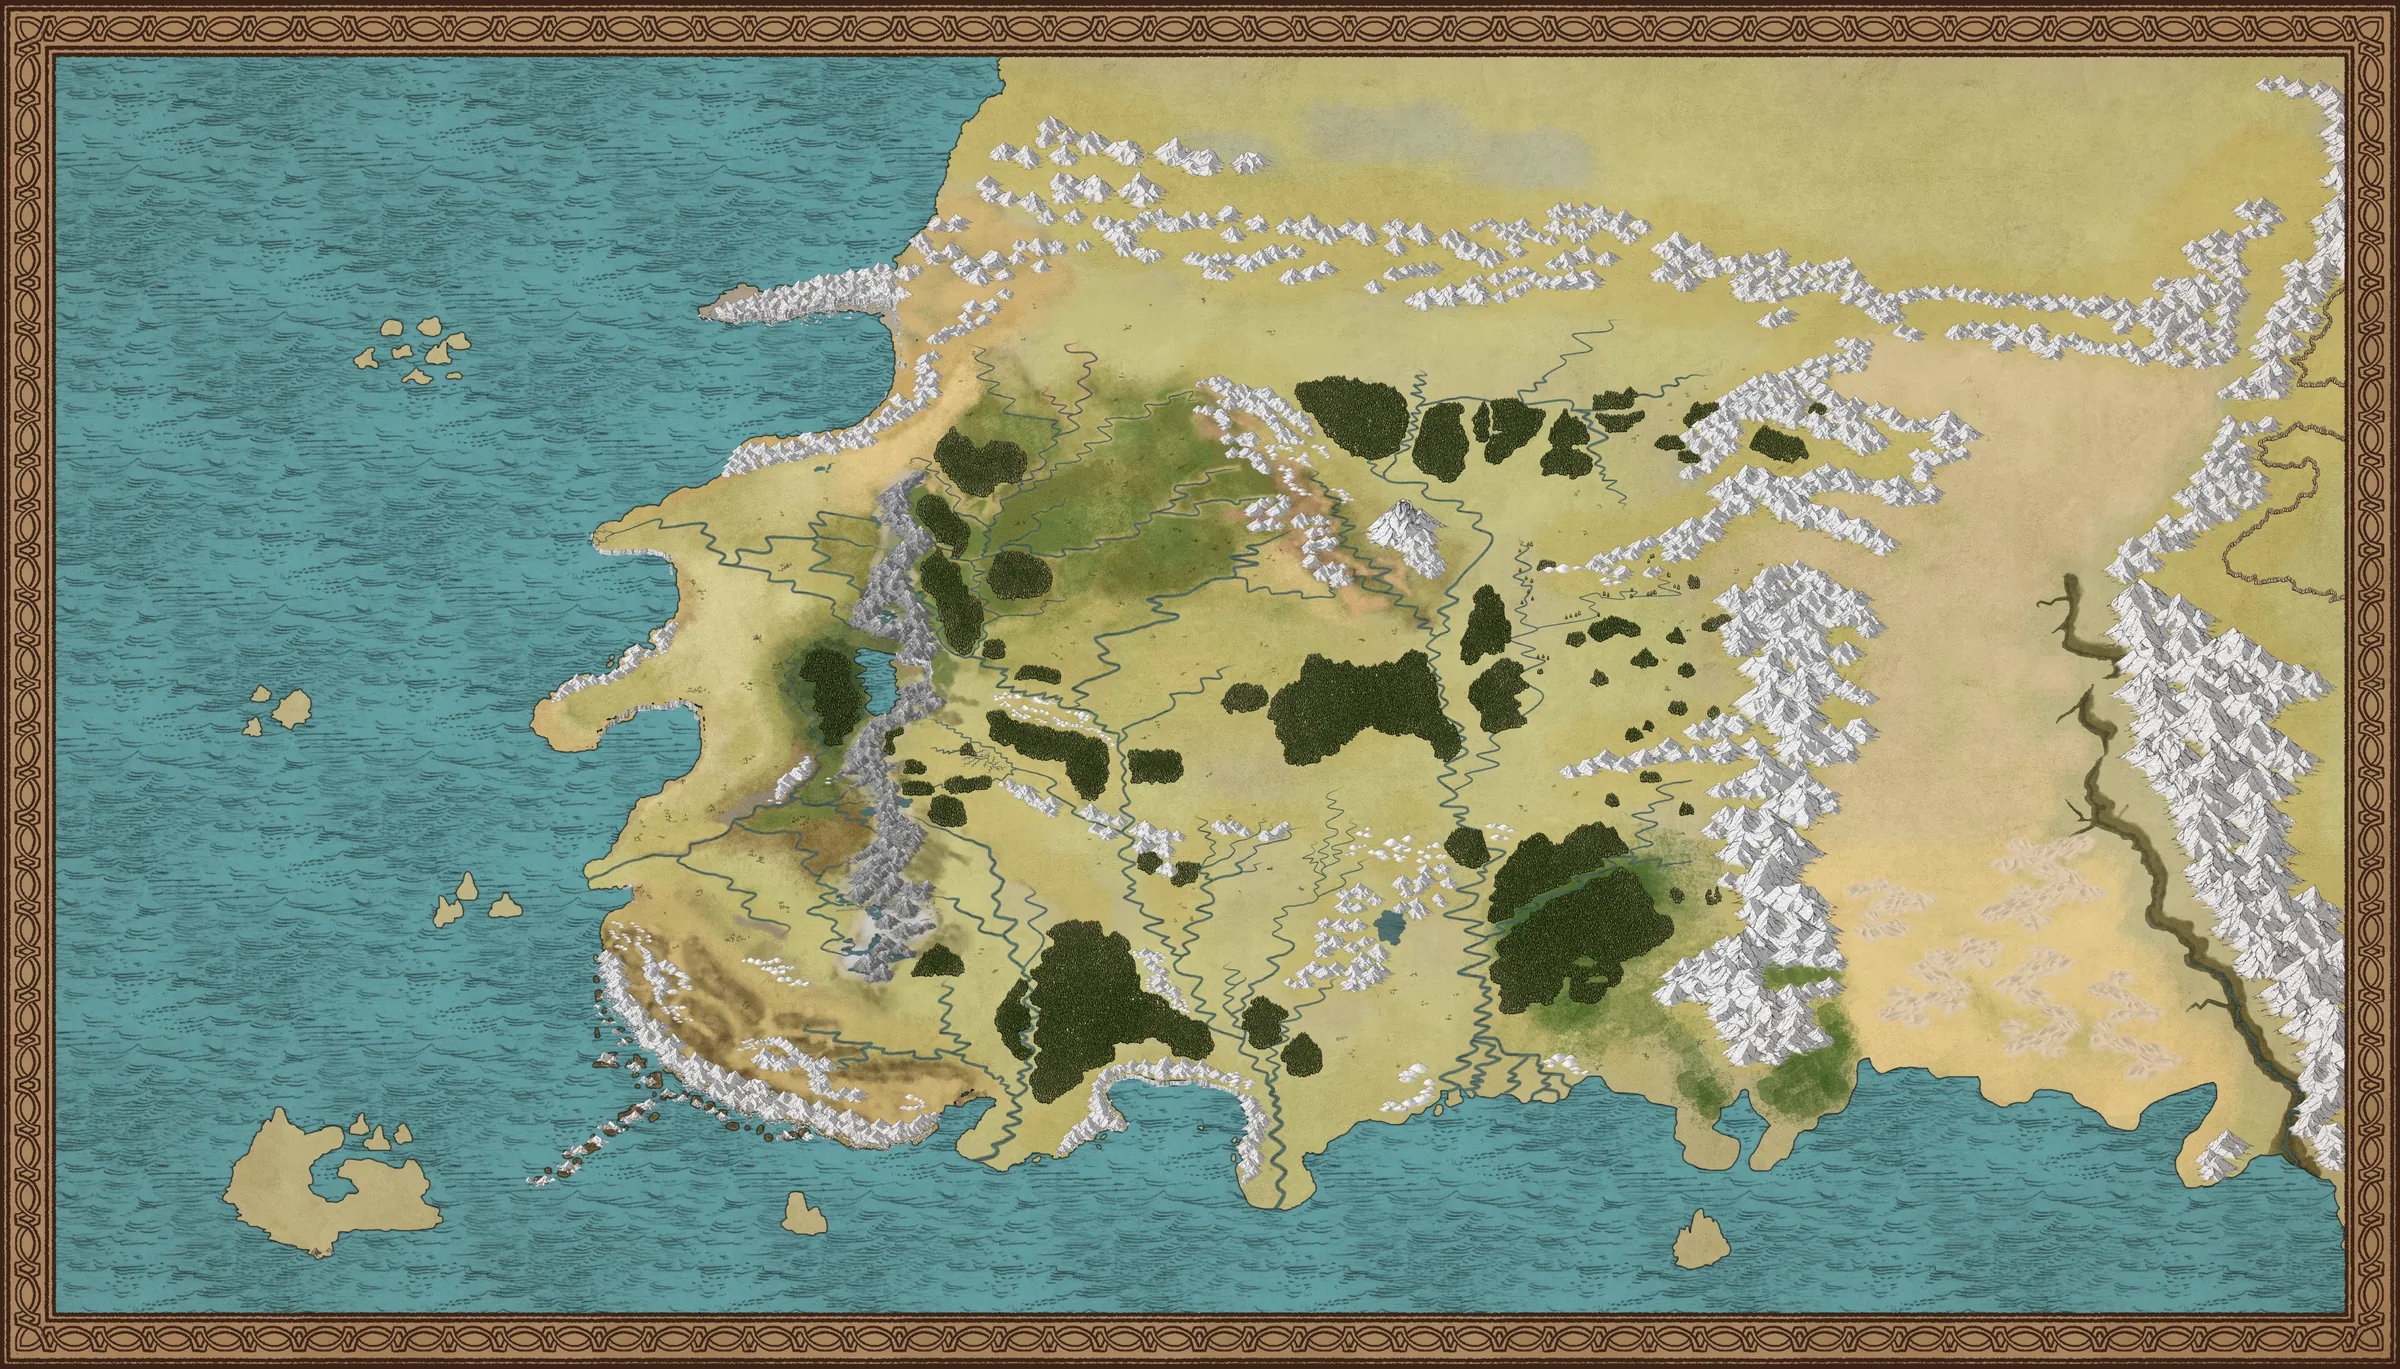 (opens full size)
Then I dropped it into a web page on my local machine, added a few markers and started experimenting with how an interactive version might work.
Technically, it worked.
But I wasn't happy with the result.
Every time I tried to improve the map, I ran into the same problem: I was spending more time fighting the artwork than building the actual application.
Eventually I lost motivation and left the project alone.
For a while, at least.
The turning point: discovering QGIS
Some time later, I came across the maps made by Red Giant. They were fantasy maps built for D&D-style worlds, but what caught my attention wasn't just how they looked. It was how they were made.
The creator, Ross Thorn, had written about the process and mentioned something I'd never really considered using for fantasy mapping:
QGIS.
QGIS is free, open-source GIS software normally used for real-world geographic work. Cities, roads, terrain, environmental data, research and all sorts of other things.
It turns out there's no reason you can't use the same tools for a fictional world.
That completely changed how I approached the project.
Instead of trying to draw one beautiful giant image, I could treat the world as actual geographic data.
I could trace the coastline, shape the landmass, carve rivers into it, define forests and mountains, and attach information to individual locations.
And, most importantly, I could give all of that data to a web map.
I was hooked again.
Building the world in QGIS
The basic idea behind the map is actually pretty simple.
A map isn't one image. It's a collection of layers, and each layer contains different types of geographic information.
There are three basic kinds of geometry:
- Points for cities, villages, ruins and other locations.
- Lines for roads and character routes.
- Polygons for landmasses, countries, forests, mountains, lakes and other areas.
Rivers are a little different in my implementation. Rather than simply drawing them as lines on top of the map, they're cut into the actual landmass. This makes them part of the geography itself rather than just another visual layer sitting on top.
Each object can also contain information about itself.
What's it called?
What type of place is it?
Which book does it first appear in?
Which chapter?
Who travelled through it?
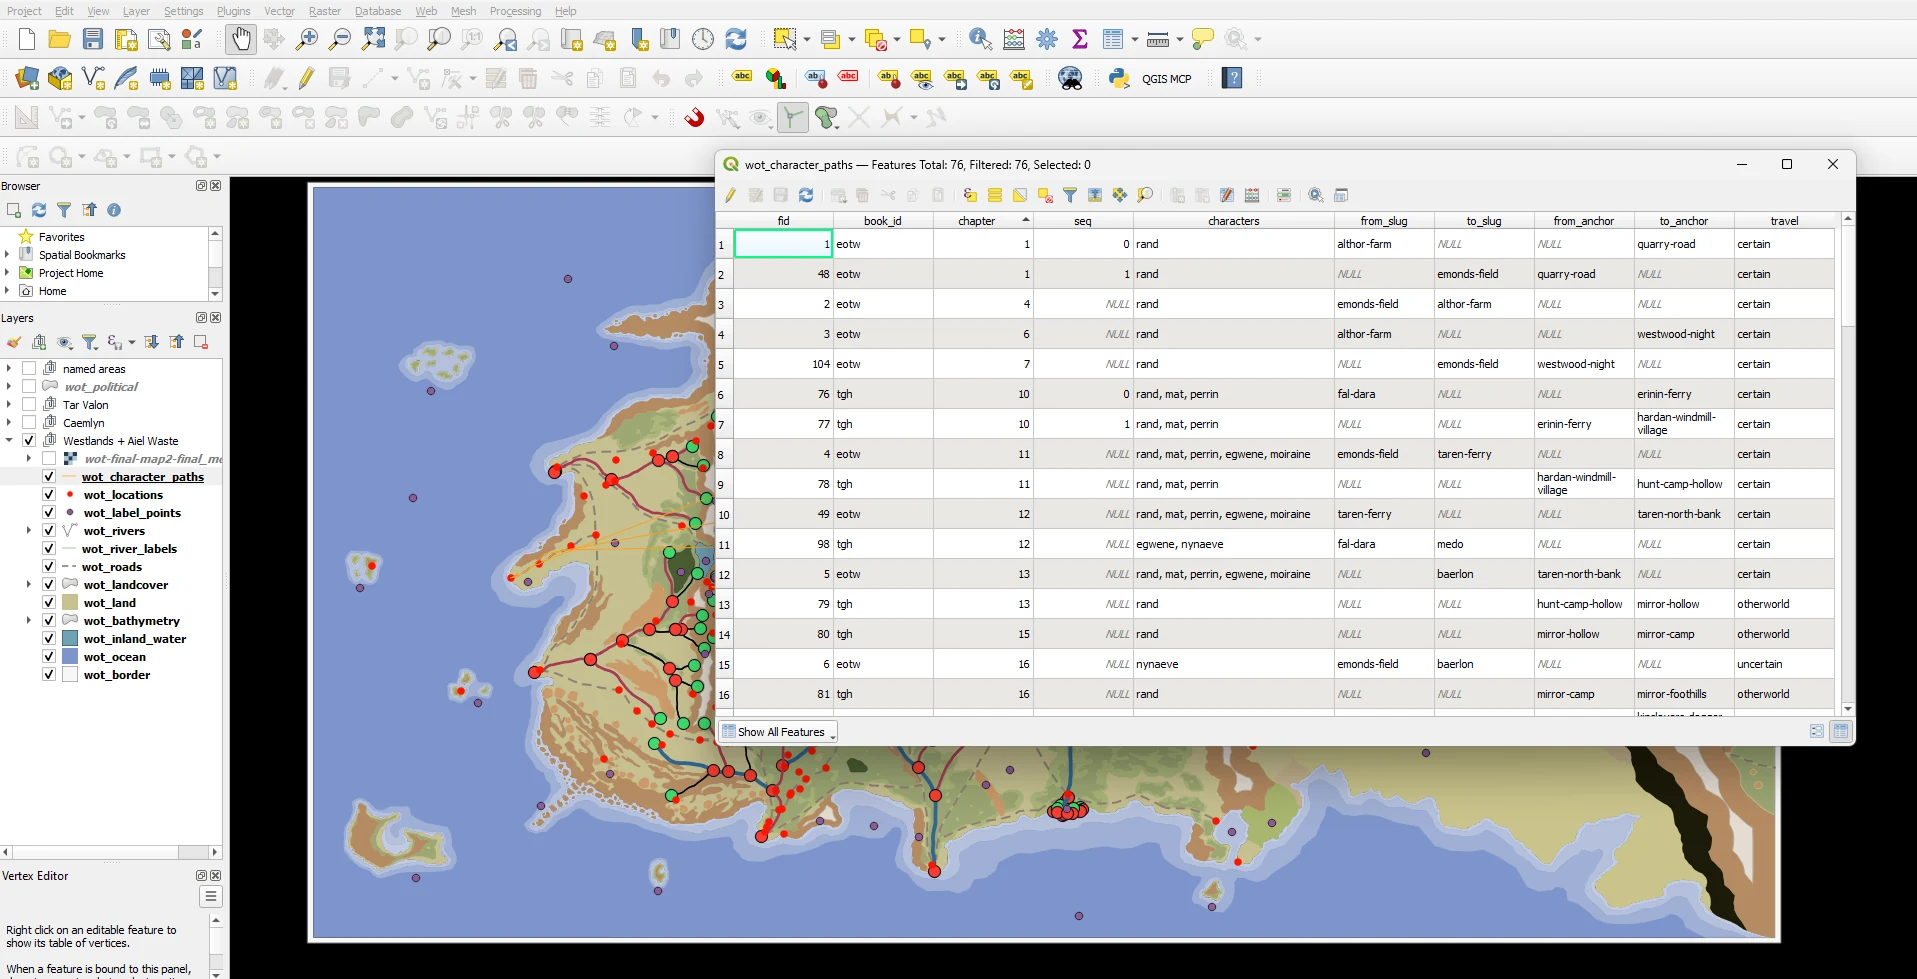 (opens full size)
That information is what eventually allows the website to do things that a normal image can't: search, filter, highlight, animate and, most importantly, hide spoilers, all tied together in one database.
The basic workflow looks like this:
- I load a reference map into QGIS and align it with the coordinate system I'm using.
- I trace coastlines, landmasses, mountains, forests, borders and other features as geographic shapes.
- I carve rivers into the landmass and add locations and other points of interest.
- I give the world a consistent scale. I also compare distances with what people have estimated online, so distances on the website aren't completely arbitrary.
- I export the geographic data into formats such as GeoJSON.
- I convert the data into vector tiles using MBTiles/PMTiles.
- The website loads those tiles using MapLibre.
Vector tiles are particularly useful here. Instead of downloading one enormous map image, the browser only loads the pieces of the world it currently needs.
And because the underlying data is vector geometry, I can style it with code, highlight individual features, animate things and change the appearance depending on zoom level.
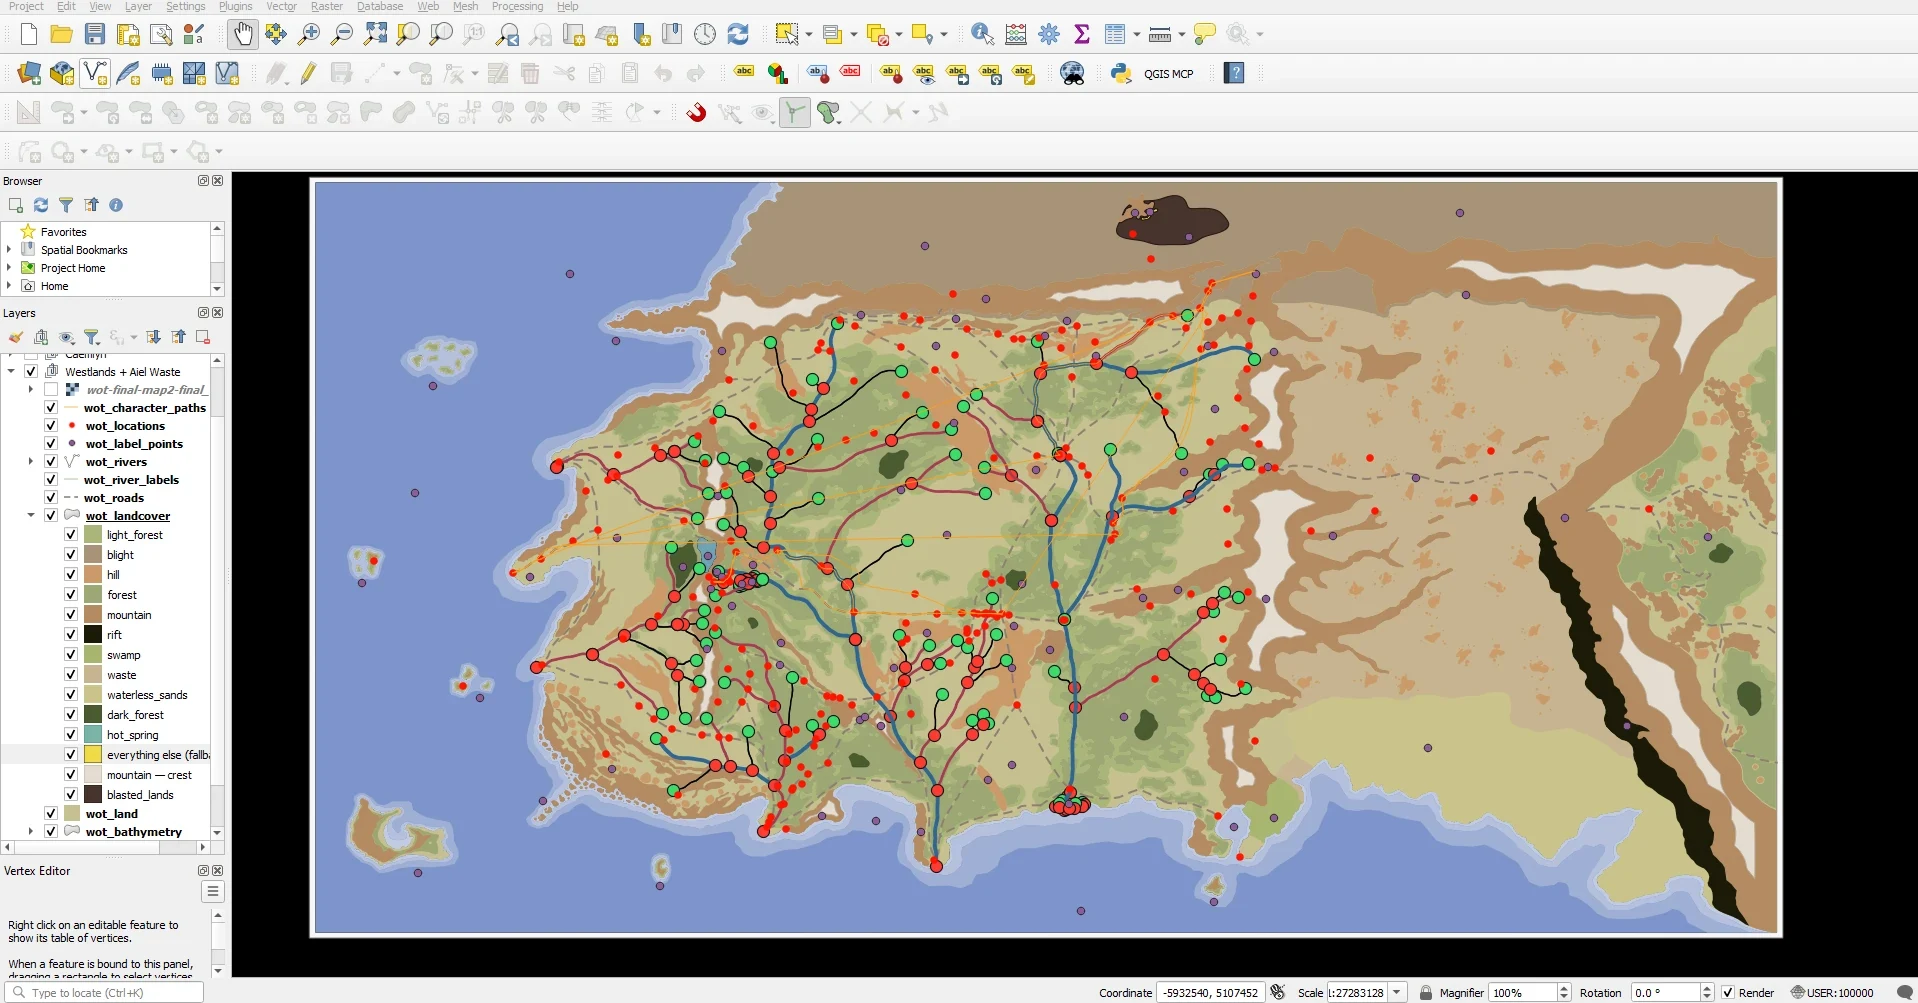 (opens full size)
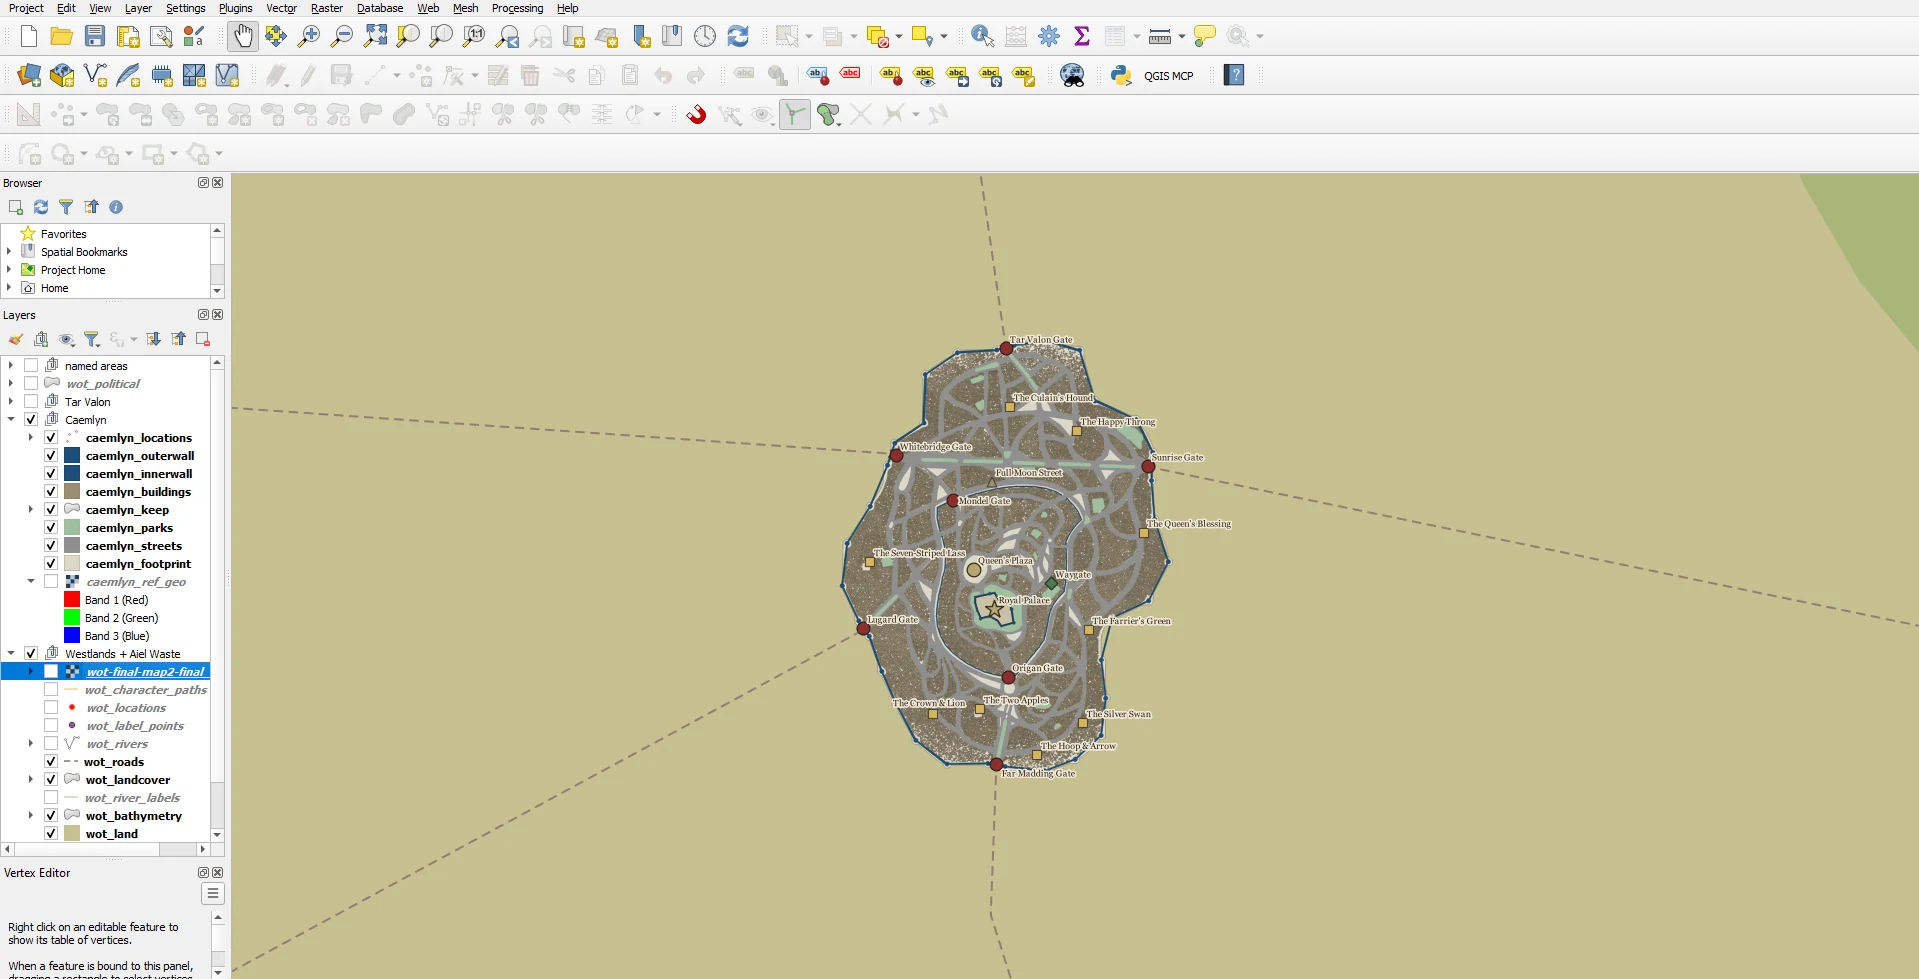 (opens full size)
This was the point where the project stopped being "trying to draw a fantasy map" and became an actual mapping project.
Where the map data comes from
The official maps from the books are the starting point.
From there, I use the books themselves, existing fan mapping work and various references to fill in the details.
For towns, locations, mountains, hills, forests, rivers and other geographic features, my main references are Adam Whitehead's 2020 Map of the Westlands, from his Wheel of Time Atlas, and other interpretations of the map I found online.
Building the terrain
A flat map didn't quite feel right for a world with the Spine of the World, the Mountains of Mist and all the other major mountain ranges.
So I built a height map as well.
A height map is basically a greyscale representation of elevation: darker areas are lower and brighter areas are higher.
Of course, nobody has actually measured the elevation of the Westlands.
So I had to construct it.
The process was roughly:
- I traced every mountain range, hill and lowland by hand in QGIS and gave each kind of terrain its own height range. Those shapes decide where every range is and how high it reaches.
- Those values were turned into a raw elevation raster.
- The first result looked more like a collection of giant flat steps than a real landscape.
- To give the steps real ridges and valleys, I borrowed real terrain: free elevation data from real mountains, blended into my own shapes. I picked ranges on Earth at a similar scale, like the central Andes for the Spine of the World, which even has a desert where the Waste would be. Only the texture is borrowed, never the heights. The data comes from a free public source, AWS Terrain Tiles, and I processed it with GDAL, the same open-source library QGIS uses under the hood.
- I carved the rivers in and brought the result back into QGIS for hillshading on the 2D map and for the 3D terrain view.
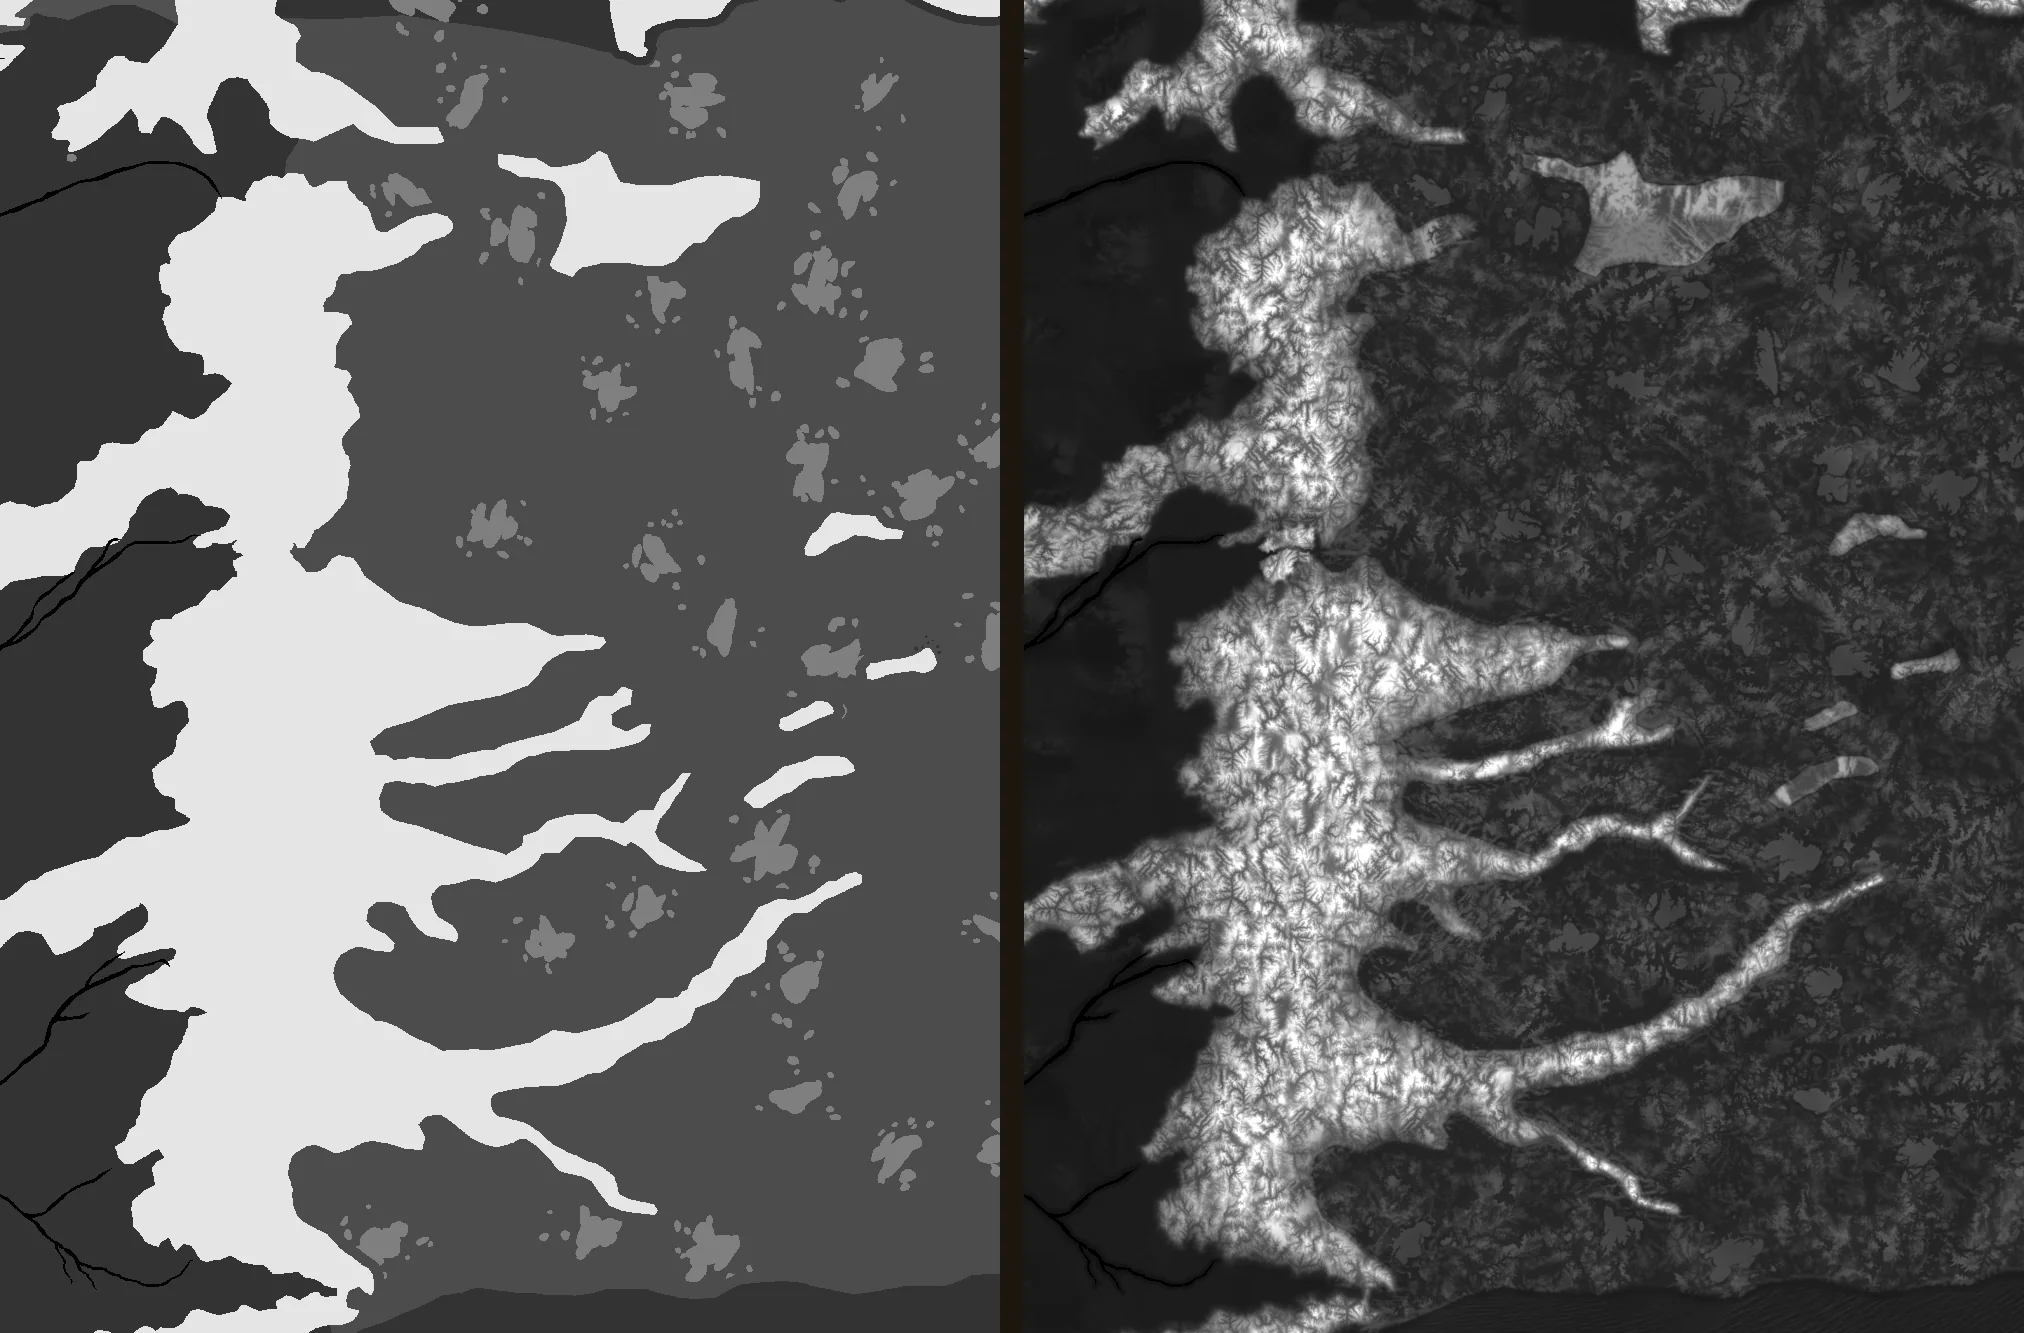 (opens full size)
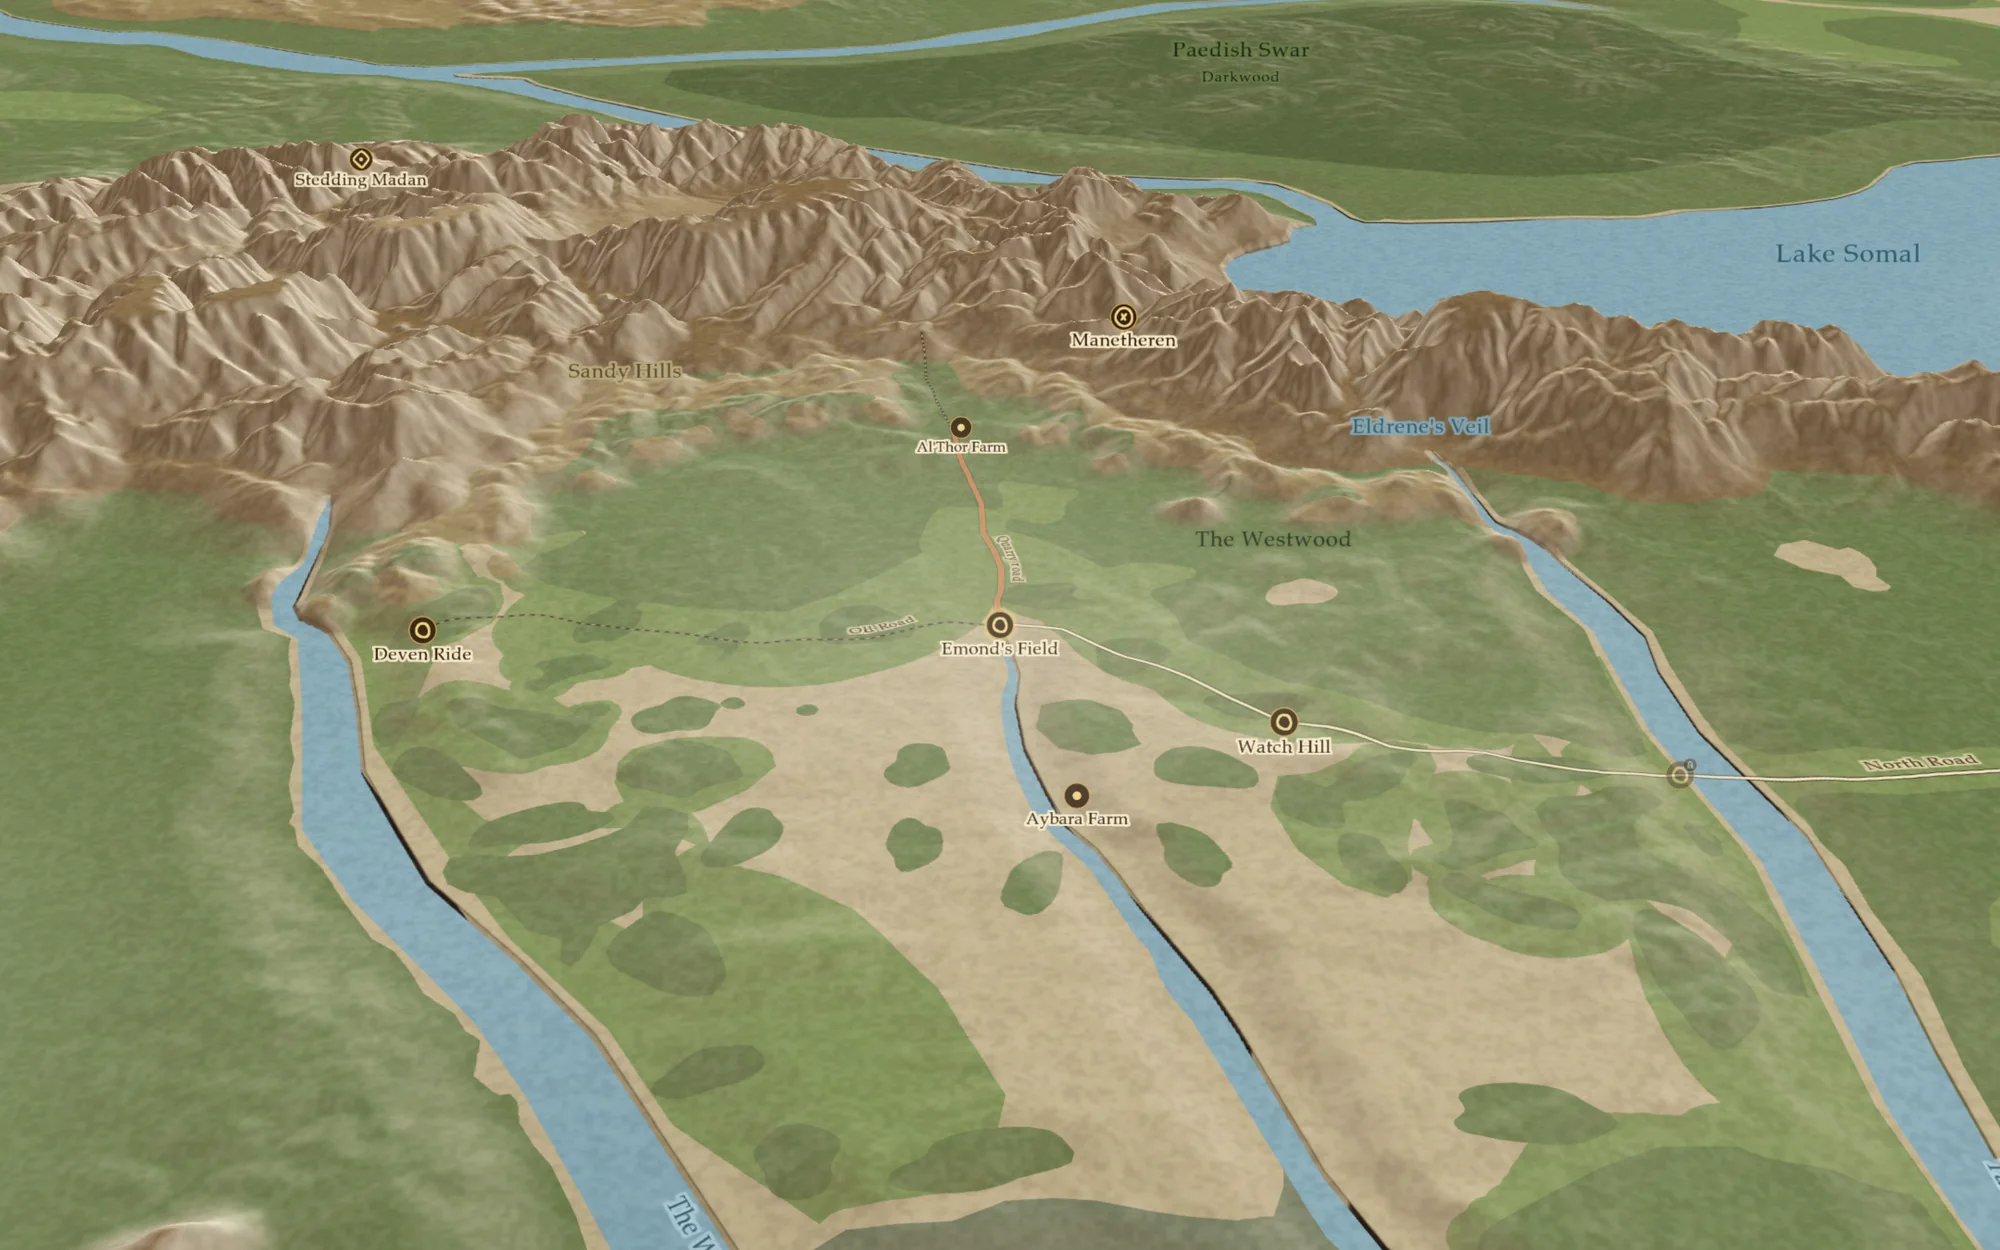 (opens full size)
It's not meant to be a scientifically accurate elevation model. It's an attempt to turn the geography described in the books into a believable landscape while keeping the important features in the right places.
Spoiler protection was part of the plan from the beginning
This is probably the most important feature of the entire project for me.
I didn't want the map to become another way of accidentally ruining the story for someone.
Every location, path and event can be associated with the book and chapter where it becomes relevant.
The idea is simple: tell the website how far you've read, and it only shows you what you've reached.
Character routes can appear chapter by chapter as the story progresses.
Someone reading The Eye of the World shouldn't suddenly see something that happens five books later just because they clicked on the wrong part of the map.
At the same time, someone who has finished the series should be able to turn everything on and explore the entire world.
The map should work for both.
Why I want the community involved
I'm also very aware that one person isn't going to get every detail right.
Especially with a series as large as The Wheel of Time.
There will be locations I've placed incorrectly. There will be routes I've misunderstood. There will be details I've missed completely.
So I want the map to have a proper suggestion system.
If you think a city should be somewhere else, you should be able to suggest a correction.
If a character's route is wrong, you should be able to point it out.
Ideally, you can attach the relevant passage from the book so there's an actual source behind the suggestion.
Suggestions can then be discussed, voted on and reviewed before becoming part of the map.
Over time, the goal is for the map to become something that gets better because readers are checking it.
That's also something I think is particularly valuable in an age where it's very easy to ask an AI chatbot a question about a fictional world and get a very confident answer that happens to be completely wrong.
I'd rather have a map where the underlying information can be traced back to the books and challenged by readers.
What's next: a gallery made by readers
The map isn't meant to be only about geography.
One feature I'd like to add is the ability for readers and artists to submit their own artwork for specific locations.
The artwork would be credited to its creator and could eventually be displayed directly on the map alongside the location it depicts.
I'd love for that to grow into a community-made gallery of Wheel of Time artwork tied to the world itself.
That feels much more interesting to me than trying to make everything myself.
So, is the map AI-generated?
No.
But I understand why someone might look at it and wonder.
We're surrounded by AI-generated images now, and a polished fantasy map can easily look like something that was produced by an image generator.
The reality is much less glamorous.
It's been a lot of reading, a failed attempt at learning to draw, QGIS, open-source software, geographic data, countless corrections, and a ridiculous number of evenings spent tracing coastlines and shaping the world one feature at a time.
I do want to be upfront about one thing: I used an AI coding agent while building the website itself, to speed up development. A simple example of why: the site has a page for every place, character and book, and they all share the same layout. I design that layout once, and the agent helps wire it up for each kind of page in an evening instead of a few weeks. The same goes for the scripts that move the map data between formats, the kind of repetitive code that's slow to type and easy to get wrong.
What it doesn't do is decide what's on the map. No part of the map comes from an image generator. I'm the one tracing it, placing things and checking them against the books. The agent just helps me build the tool around it faster, which matters when you're one person working on this in the evenings.
The map is still very much a work in progress.
And that's part of the reason I'm putting this process out there.
If you spot something that's wrong, tell me.
If you've found a better source for a location, let me know.
If I've completely misunderstood how two places connect, I'd rather hear about it.
The goal isn't to make a map that I alone think is correct.
It's to build the best interactive Wheel of Time map I can, and keep making it better as more readers use it.
Explore MapDruid